slice viewer
Submitted by junesums on Wed, 03/25/2009 - 15:53
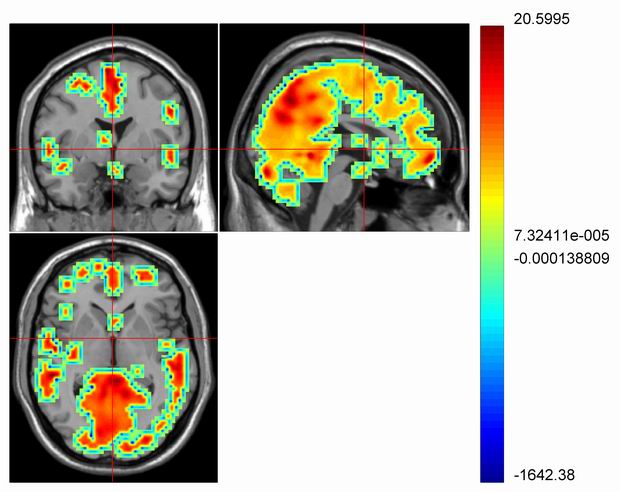
用liice viewer查看结果,发现激活区被其他颜色环绕,怎么调参数都去不掉。如图所示,显示的是组内的单样本T检验,Overlay的threshold是4.5,range也设成只看正值了。是怎么回事呢?
Forums:
- Read more about slice viewer
- 7 comments
- Log in or register to post comments
- 26260 reads